GraphicsJS 1.2.0
GraphicsJS is a free, open-source JavaScript library for easily drawing any interactive HTML5 graphics and animation. It's lightweight and supports powerful line drawing (curves, arcs...), multiline texts, virtual DOM, smart layering, convenient API.
Product Specifications
| User Rating: | item has less then 1 vote |
|
| FileCart Rating | Not yet Rated | |
| Submitted by: | anychart | |
| Homepage | Visit Homepage | |
| License | Freeware | |
| Price | $0.00 | |
| Downloads | 411 | |
| OS Support | Windows Install and Uninstall | |
| File Name | v1.2.0.zip | |
| File Size | 0.41 MB ( 418 KB ) | |
| Published | Sep 15, 2016 (10 years ago) | |
| Updated | Mar 03, 2017 (9 years ago) | |
Follow Us!
Latest Searches
evosol pediatrics internship 3 minutes ago
Bubble Odyssey 9 minutes ago
Legacy T6 Protocol 10 minutes ago
ada parsel 15 minutes ago
samathi jearanaiphaisan 15 minutes ago
iphone 13 vs15 15 minutes ago
lecart 16 minutes ago
In the scientific method, a hypothesis is a(n) ________.a. observation 19 minutes ago
formato excel abbreviato 20 minutes ago
Popular Searches
id cards 602 times
2025 480 times
2024 386 times
Softperfect 327 times
2026 266 times
Database Workbench Pro 258 times
TeraByte Drive Image Backup and Restore 255 times
Elcomsoft Phone Breaker 251 times
ia que faz video com imagem 18 245 times
Product Details
Key features of GraphicsJS library making it stand out:
- Rich line drawing - not only Bezier curves, but also any deformations including arcs and other curves.
- Powerful text features - multiline texts, text measurement, including width, height, as well as wrap, overflow, indent, spacing, align, etc.
- Virtual DOM, designed for drawing rapidly and only what is necessary.
- Smart layering system including z-index.
- Its own transformation engine, with no need to use embarrassing in-browser transformations.
- Cross-browser support including legacy browsers (IE6+).
- Convenient JavaScript API, concise and with chaining support.
Developed and previously used as the graphics engine laid down in the foundation of the commercial charting libraries produced by AnyChart - AnyChart, AnyMap, AnyStock, and AnyGantt - GraphicsJS already operates data visualization solutions implemented by Oracle, Microsoft, Volkswagen, AT&T, Samsung, BP, Bosch, Merck, Reuters, Bank of China, Lockheed Martin, and thousands of other prominent customers of AnyChart, including over 70% of Fortune 1000 list companies.
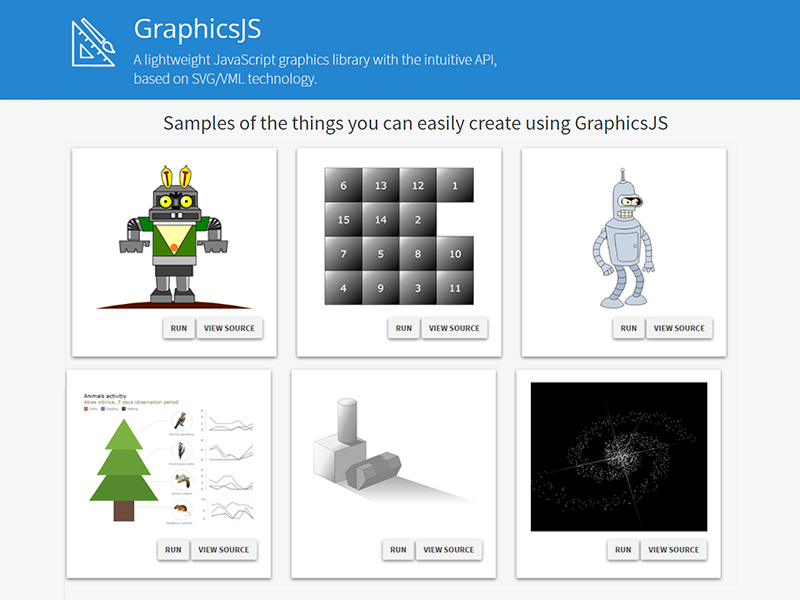
Interactive data visualization is only one of multiple cases the rich GraphicsJS library can be used for. For instance, it also may be utilized for creating literally any images and graphics-related solutions and patterns including animated pictures, infographics, cartoons, and so on. Currently available demos include Galaxy, Rain, Bender from Futurama, Bonfire, 15-Puzzle, and more.
| Requirements: | None. JavaScript-based |
| Release Info: | Major Update on Feb 28, 2017 |
| Release Notes: | Updated Closure and Closure Compiler to v. 20161024. Improved performance: optimized process of getting link to container for stage; resize events are now delivered using Timer object instead of iFrame element. Fixed gradients in Firefox 51+. Fixed export to image when dimensions are specified. |
| Related Tags: | JavaScript SVG VML opensource graphics |
Reviews
Reviews of GraphicsJS 1.2.0
You can be the first to write a review of GraphicsJS!Other products submitted by this publisher
AnyChart is a flexible, cross-platform/browser, dependency-free JS chart library for adding interactive bar, area, pie, column, spline, scatter, line, gauge, treemap, funnel, sparkline, and many other HTML5 charts and dashboards to any website/app.
AnyGantt JS Gantt ChartsAnyGantt is a flexible, cross-platform and cross-browser JavaScript charting library that allows you to easily build smart HTML5 Gantt Charts and utilize the power of animation and ultimate interactivity to facilitate project and resource management.
AnyMap JS MapsAnyMap JS Maps is an advanced JavaScript-HTML5 mapping library with the ever-expanding Map Collection, which makes you able to easily create interactive maps looking great on PCs, Macs, iPhones, iPads, Androids and other devices. Highly customizable.
AnyStock Stock and Financial JS ChartsAnyStock Stock and Financial JS Charts is a flexible JavaScript charting library to visualizing large data sets in interactive HTML5 charts. Designed to display date/time information it offers various chart types, drawing tools, technical indicators.
Most Viewed Windows Java and Javascript
dhtmlxTree :: Ajax-Based JavaScript Tree 5.0
Jasob JavaScript Obfuscator 4.1.1
Bouncing Ball with Gravity 1
Sothink Tree Menu 3.1
DHTMLX Library :: Ajax UI Components 2.6
2D/3D Horizontal Bar Graph Software 4.63
dhtmlxTabbar :: Ajax/JavaScript Tabs 5.0
dhtmlxScheduler :: Ajax Event Calendar 4.3
AllWebMenus Javascript Menu Dreamweaver Extension 1.0.1
Most Downloaded Windows Java and Javascript
Jasob JavaScript Obfuscator 4.1.1
dhtmlxMenu :: DHTML/JavaScript Menu 4.0
CodeThat Studio 2.5.0
CodeThatGrid JavaScript Grid 2.2.8
Advanced Scrolling Text Software 4.7
dhtmlxTabbar :: Ajax/JavaScript Tabs 5.0
DHTMLX Library :: Ajax UI Components 2.6
dhtmlxToolbar :: JavaScript Toolbar 5.0
AllWebMenus LITE 4.1.624