AnyGantt JS Gantt Charts 8.7.0
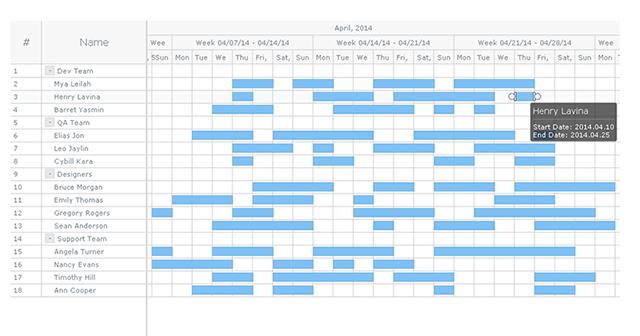
AnyGantt is a flexible, cross-platform and cross-browser JavaScript charting library that allows you to easily build smart HTML5 Gantt Charts and utilize the power of animation and ultimate interactivity to facilitate project and resource management.
Product Specifications
| User Rating: | item has less then 1 vote |
|
| FileCart Rating | Not yet Rated | |
| Submitted by: | anychart | |
| Homepage | Visit Homepage | |
| License | Shareware | |
| Price | $49 | |
| Downloads | 555 | |
| OS Support | Windows Install and Uninstall | |
| File Size | 17.81 MB ( 18,234 KB ) | |
| Published | Dec 25, 2015 (11 years ago) | |
| Updated | Mar 03, 2017 (9 years ago) | |
Follow Us!
Latest Searches
mega fit plus 48 seconds ago
serotonin syndrome dose 3 minutes ago
dispatch bao 4 minutes ago
Bankomat 4 minutes ago
astm a514 carbon steel 5 minutes ago
mercadolibre colombia 6 minutes ago
datos facticos 6 minutes ago
jaguarandi 7 minutes ago
hydro flask 9 minutes ago
Popular Searches
id cards 602 times
2025 489 times
2024 386 times
Softperfect 328 times
2026 274 times
Database Workbench Pro 258 times
TeraByte Drive Image Backup and Restore 255 times
Elcomsoft Phone Breaker 251 times
ia que faz video com imagem 18 251 times
Product Details
AnyGantt is fully cross-browser and cross-platform. It can be used with ASP.NET, ASP, PHP, JSP, ColdFusion, Ruby on Rails or simple HTML pages. With AnyGantt you can visualize data from any warehouse: from files in text, Excel, CSV formats to MySQL, MS SQL, and Oracle database servers.
You can use server or desktop platform of your choice to create your application - AnyGantt will take care of charting. Right visualization helps you to turn your data into Right Decisions! If you need advanced, award-winning Gantt diagrams, then AnyGantt is the perfect solution for you.
Features:
* AnyGantt supports Project (Task-based) and Schedule (Resource-based) Gantt charts for project planning, and PERT (Program Evaluation & Review Technique) charts for decision making - all with configurable Timeline, DataGrid, and other features.
* Style Based Visualization allows developers to focus on the business logic. Nicely designed defaults allow keeping design tasks away at all!
* For all text-based elements, such as labels, tooltips or data-grid columns AnyGantt features powerful formatting options.
* Data Grid that holds basic task or resource information is highly configurable. You can add any number of custom columns that can contain additional task or resource data. Each column can have custom text formatting, height and text style settings. Data grid itself can be redesigned to reflect important data specifics.
* Each element of AnyChart Gantt charts can be configured in its own way with a help of the flexible design system.
* AnyGantt is a JavaScript-based component, which can be used in any Web project. It doesn't depend on any server-side platform, all you need is JavaScript enabled browser on client-side.
| Requirements: | None. JavaScript/HTML5 based; compatible with all devices, platforms and browsers. |
| Release Info: | Major Update on Aug 08, 2019 |
| Release Notes: | Client-side export - save data visualizations as images (SVG, PNG, and JPG) and PDF documents without a roundtrip to the server. Other new features in Gantt charts: Milestone preview on parent task bar. Custom markers for project activity milestones. Custom basic year (fiscal, academic, etc.). |
| Related Tags: | anygantt gantt charts javascript charts ajax charts html5 charts |
Reviews
Reviews of AnyGantt JS Gantt Charts 8.7.0
You can be the first to write a review of AnyGantt JS Gantt Charts!Other products submitted by this publisher
AnyChart is a flexible, cross-platform/browser, dependency-free JS chart library for adding interactive bar, area, pie, column, spline, scatter, line, gauge, treemap, funnel, sparkline, and many other HTML5 charts and dashboards to any website/app.
AnyMap JS MapsAnyMap JS Maps is an advanced JavaScript-HTML5 mapping library with the ever-expanding Map Collection, which makes you able to easily create interactive maps looking great on PCs, Macs, iPhones, iPads, Androids and other devices. Highly customizable.
AnyStock Stock and Financial JS ChartsAnyStock Stock and Financial JS Charts is a flexible JavaScript charting library to visualizing large data sets in interactive HTML5 charts. Designed to display date/time information it offers various chart types, drawing tools, technical indicators.
GraphicsJSGraphicsJS is a free, open-source JavaScript library for easily drawing any interactive HTML5 graphics and animation. It's lightweight and supports powerful line drawing (curves, arcs...), multiline texts, virtual DOM, smart layering, convenient API.
Most Viewed Windows Java and Javascript
dhtmlxTree :: Ajax-Based JavaScript Tree 5.0
Jasob JavaScript Obfuscator 4.1.1
Bouncing Ball with Gravity 1
Sothink Tree Menu 3.1
DHTMLX Library :: Ajax UI Components 2.6
2D/3D Horizontal Bar Graph Software 4.63
dhtmlxTabbar :: Ajax/JavaScript Tabs 5.0
dhtmlxScheduler :: Ajax Event Calendar 4.3
AllWebMenus Javascript Menu Dreamweaver Extension 1.0.1
Most Downloaded Windows Java and Javascript
Jasob JavaScript Obfuscator 4.1.1
dhtmlxMenu :: DHTML/JavaScript Menu 4.0
CodeThat Studio 2.5.0
CodeThatGrid JavaScript Grid 2.2.8
Advanced Scrolling Text Software 4.7
dhtmlxTabbar :: Ajax/JavaScript Tabs 5.0
DHTMLX Library :: Ajax UI Components 2.6
AllWebMenus LITE 4.1.624
dhtmlxToolbar :: JavaScript Toolbar 5.0