AnyMap JS Maps 8.7.0
AnyMap JS Maps is an advanced JavaScript-HTML5 mapping library with the ever-expanding Map Collection, which makes you able to easily create interactive maps looking great on PCs, Macs, iPhones, iPads, Androids and other devices. Highly customizable.
Product Specifications
| User Rating: | item has less then 1 vote |
|
| FileCart Rating | Not yet Rated | |
| Submitted by: | anychart | |
| Homepage | Visit Homepage | |
| License | Shareware | |
| Price | $49 | |
| Downloads | 578 | |
| OS Support | Windows Install and Uninstall | |
| File Size | 17.81 MB ( 18,234 KB ) | |
| Published | Jun 03, 2016 (10 years ago) | |
| Updated | Mar 03, 2017 (9 years ago) | |
Follow Us!
Latest Searches
VP of Contract Management digital realty 8 minutes ago
CEP ITABIRITO 11 minutes ago
Portable 5 channel sunphotometer for measuring aerosolSunphotometer6640 KY 10104588optical thickness, direct solar irradiance and water vapor column. 13 minutes ago
how much do saori tatsuno love reference material from yani neko episode 4 13 minutes ago
la poderosa 990 am en vivo ahora 14 minutes ago
y´´\7´´+ 14 minutes ago
baxter auto parts closing stores 15 minutes ago
megazonelasertag.html?highlight=0 20 minutes ago
what time and channel is the correspondents dinner on tonight 22 minutes ago
Popular Searches
id cards 602 times
2025 493 times
2024 386 times
Softperfect 328 times
2026 278 times
Database Workbench Pro 258 times
5g spf sonicwall compatible copper module 258 times
TeraByte Drive Image Backup and Restore 255 times
targetamazon credit card.asp?highlight=0 253 times
Product Details
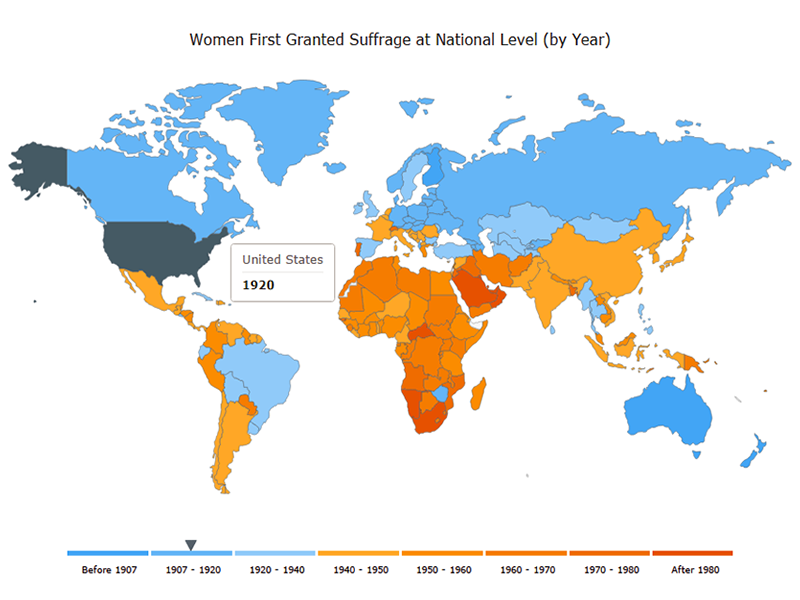
AnyMap JS is perfect for interactive dashboards and side-by-side reporting. You can use it to display sales by region, election results, weather forecast, population density, and any other geo-related data.
AnyMap JS comes with our ready-to-use Map Collection which you can use at no additional cost. Maps are supplied in GeoJSON, which makes them flexible in working and editing. Custom maps can be created from any SHP map.
AnyMap JS maps are fully compatible with other AnyChart JS Charts' HTML5 charting solutions - AnyChart JS (basic JavaScript charts), AnyStock JS (date/time JavaScript/HTML5 charts, e.g. financial and stock charts that visualize real-time data), and AnyGantt JS (JavaScript/HTML5 Gantt charts), and can be used both in a dashboard and as a standalone map visualization solution.
Features of AnyMap JS:
* Ever-expanding Map Collection with various country-specific and world maps.
* Highly customizable. Special reaction to certain events can be assigned with the help of event listeners.
* Wide variety of interactive options for your HTML5 maps, including tooltips, selection, hover, drill-down, etc.
* Support for various types of maps including Choropleth Map, Point (Dot) Map, Bubble Map, Connector Map, and Seat Map for displaying data related to geographic areas in HTML5 based web projects.
* Longitude/latitude support allows you to set coordinates (location) of Bubbles in Bubble JavaScript Charts in long/lat degrees. The API allows you to convert mouse coordinates to longitude and latitude (transform), and vice versa.
* Changing scale, moving map, and creating custom UI (buttons, scrolls, etc.) via API.
* Rich integration of keyboard and mouse controls.
* Map projections.
| Requirements: | None. JavaScript/HTML5 based; compatible with all devices, platforms and browsers. |
| Release Info: | Major Update on Aug 08, 2019 |
| Release Notes: | Client-side export - save your data visualizations as images (SVG, PNG, and JPG) and PDF documents without a roundtrip to the server. Polygonal selection - select points on JS map charts by drawing a polygone; can be configured using the API and is also available to the end user from context menu. |
| Related Tags: | javascript maps html5 maps anychart anymap interactive map |
Reviews
Reviews of AnyMap JS Maps 8.7.0
You can be the first to write a review of AnyMap JS Maps!Other products submitted by this publisher
AnyChart is a flexible, cross-platform/browser, dependency-free JS chart library for adding interactive bar, area, pie, column, spline, scatter, line, gauge, treemap, funnel, sparkline, and many other HTML5 charts and dashboards to any website/app.
AnyGantt JS Gantt ChartsAnyGantt is a flexible, cross-platform and cross-browser JavaScript charting library that allows you to easily build smart HTML5 Gantt Charts and utilize the power of animation and ultimate interactivity to facilitate project and resource management.
AnyStock Stock and Financial JS ChartsAnyStock Stock and Financial JS Charts is a flexible JavaScript charting library to visualizing large data sets in interactive HTML5 charts. Designed to display date/time information it offers various chart types, drawing tools, technical indicators.
GraphicsJSGraphicsJS is a free, open-source JavaScript library for easily drawing any interactive HTML5 graphics and animation. It's lightweight and supports powerful line drawing (curves, arcs...), multiline texts, virtual DOM, smart layering, convenient API.
Most Viewed Windows Java and Javascript
dhtmlxTree :: Ajax-Based JavaScript Tree 5.0
Jasob JavaScript Obfuscator 4.1.1
Bouncing Ball with Gravity 1
Sothink Tree Menu 3.1
DHTMLX Library :: Ajax UI Components 2.6
2D/3D Horizontal Bar Graph Software 4.63
dhtmlxTabbar :: Ajax/JavaScript Tabs 5.0
dhtmlxScheduler :: Ajax Event Calendar 4.3
AllWebMenus Javascript Menu Dreamweaver Extension 1.0.1
Most Downloaded Windows Java and Javascript
Jasob JavaScript Obfuscator 4.1.1
dhtmlxMenu :: DHTML/JavaScript Menu 4.0
CodeThat Studio 2.5.0
CodeThatGrid JavaScript Grid 2.2.8
Advanced Scrolling Text Software 4.7
dhtmlxTabbar :: Ajax/JavaScript Tabs 5.0
DHTMLX Library :: Ajax UI Components 2.6
AllWebMenus LITE 4.1.624
dhtmlxToolbar :: JavaScript Toolbar 5.0