ecGraph 2.13
Powerful graphing ActiveX control to create graphs in a huge range of styles. Great for scientific or technical graphs. Do a graph with just a few lines of code. Manipulate the layout at runtime. Multiple graphs. Drag, zoom and scroll. Much more.
Product Specifications
| User Rating: | item has less then 1 vote |
|
| FileCart Rating | ||
| Submitted by: | DaveEncore | |
| Homepage | Visit Homepage | |
| License | Shareware | |
| Price | $139 | |
| Downloads | 729 | |
| OS Support | Windows Install and Uninstall | |
| File Name | ecgraph.zip | |
| File Size | 1.02 MB ( 1,049 KB ) | |
| Published | Nov 08, 2005 (21 years ago) | |
| Updated | Dec 16, 2013 (13 years ago) | |
Follow Us!
Latest Searches
getintopc.com adobe mid 3 minutes ago
I have ryzen 5 5500x3d and when playing arena breakout infinite my pc blacks out and reboots I have kombo strike 2 5 minutes ago
preston pruitt obituary 6 minutes ago
XBIZ2026 8 minutes ago
autocad 2003 8 minutes ago
hafele magic corner 11 minutes ago
mitch mcconnell governor dead 13 minutes ago
netherland code 14 minutes ago
stage 2 2026 14 minutes ago
Popular Searches
id cards 602 times
2025 492 times
2024 386 times
Softperfect 328 times
2026 278 times
Database Workbench Pro 258 times
TeraByte Drive Image Backup and Restore 255 times
ia que faz video com imagem 18 252 times
targetamazon credit card.asp?highlight=0 252 times
Product Details
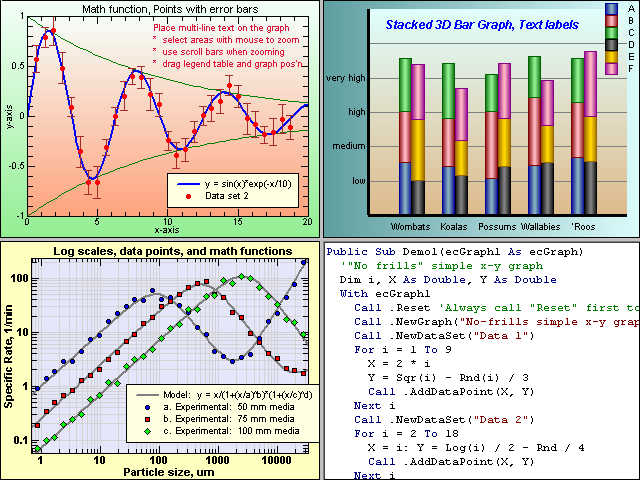
* Easily create scientific or engineering graphs within your VB applications
* Multiple graphs per page
* Click and drag to move or resize graphs on the page
* Zoom and scroll areas of the graphs
* Multiple x- and y-axes per graph
* Log or linear scales on axes
* Plot data points, bars, text
* Plot continuous math functions like y = sin(x)*exp(-x/10)
* Plot data points against math functions, with vertical or horizontal optional error bars
* Configurable grid lines, tick marks, borders, backgrounds
* Legend tables, reverse axes, show/hide labels, transparent backgrounds
* Demo projects supplied to show how all the features work
* Project1 - simple viewer to load and display the demo graphs and the VB code used to generate them.
* Project 2 - comprehensive graph editing program, loads the demo graphs and lets you edit them on screen
* Hundreds of other features
| Requirements: | Win 95/98/ME/NT/2000/XP/2003 |
| Release Info: | Minor Update on Feb 01, 2008 |
| Release Notes: | n/a |
| Related Tags: | ecGraph graph plotting plotter activex |
Reviews
You must be logged in to write a review
Reviews of ecGraph 2.13
You can be the first to write a review of ecGraph!Most Viewed Windows ActiveX
Barcode Generator ActiveX/OCX TBarCode 11.1.2
vbSkinner Pro 2.6
BarCodeWiz Barcode ActiveX Control 4.87
Dynamic Web TWAIN 12.2
TeeChart Pro ActiveX 2018
ActiveComport Serial Port Toolkit 3.0
FlexCell Grid Control for ActiveX 6.3.3
ActiveSocket Network Toolkit 3.0
csXImage 5.0
Most Downloaded Windows ActiveX
vbSkinner Pro 2.6
Dynamic Web TWAIN 12.2
ActiveComport Serial Port Toolkit 3.0
Face Recognition ActiveX DLL 1.1
FlexCell Grid Control for ActiveX 6.3.3
TeeChart Pro ActiveX 2018
Bricolsoft Zip ActiveX Component 2014
Customized Windows Logon DLL 1.25
CADViewX: ActiveX for DWG, DXF, PLT, CGM 8.0