TeeBI for RAD Studio Suite 2018
TeeBI Business Intelligence and Analytics component suite for RAD Studio developers
Product Specifications
| User Rating: | item has less then 1 vote |
|
| FileCart Rating | Not yet Rated | |
| Submitted by: | steema | |
| Homepage | Visit Homepage | |
| License | Shareware | |
| Price | $279 | |
| Downloads | 587 | |
| OS Support | Windows Install Only | |
| File Name | TeeBIForTeeChartPro.exe | |
| File Size | 88.03 MB ( 90,140 KB ) | |
| Published | Oct 16, 2017 (9 years ago) | |
| Updated | (No date provided) | |
Follow Us!
Latest Searches
dudao.ai6700.com 3 minutes ago
pevely mo mall 3 minutes ago
Explain the appointment and dr,rties of the Solicitor General of India. Are there any(Word Limit : 150 Words)lirnitations attached to his position 6 minutes ago
please list nicely the HTTP STATUS CODES SUCH AS 301 FOR EXAMPLE AND WHAT DO THEY MEAN 6 minutes ago
What is the best way to prevent the spread of infection?Use personal protective equipment.Avoid contact with ill patients.Wash your hands.Use alcohol wipes to clean surfaces.Skip to navigation 7 minutes ago
annealing ising machine AIM 9 minutes ago
newcastle herald death notices 9 minutes ago
does cedar point allow wagons 9 minutes ago
Smart fitness with YOLO Fit IoT: Real time pose analysis and personalized training via IoT and RL 9 minutes ago
Popular Searches
id cards 602 times
2025 468 times
2024 386 times
Softperfect 326 times
Database Workbench Pro 258 times
TeraByte Drive Image Backup and Restore 255 times
2026 255 times
Elcomsoft Phone Breaker 251 times
ia que faz video com imagem 18 245 times
Product Details
Support for Embarcadero IDEs (RAD Studio, Delphi and C++Builder) and FireMonkey framework. Also Lazarus and FreePascal (the minimum supported IDE is Idera/Embarcadero RAD Studio XE5 and FreePascal FPC v3.0).
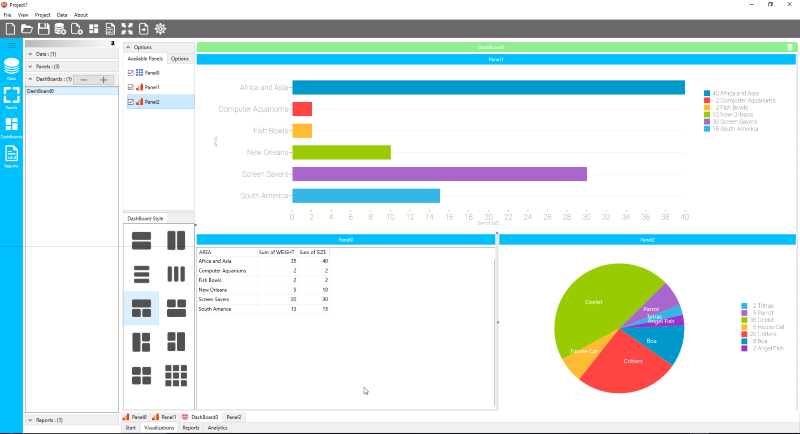
TeeBI provides a Core engine that can be configured to connect to a wide variety of data and information sources across a variety of data providers and formats. The TeeBI Core creates a common metadata format for all the information sources enabling homogenous access for all visualisation and analysis tools. To this data you can make links, view in Chart, Grid or Tree formats or create triggers to bulletin data events. Output to the desktop or to the web or create new, consolidated datasources for further data analysis. TeeBI includes Geo-mapping capabilities to bring location data, automatically to your data.
TeeBI for RAD Studio Suite includes Visualization, Web and Analysis components for RAD Studio with 100% sourcecode and comes with a renewable one-year subscription service that entitles customers to free updates and technical support.
| Requirements: | Multi-platform Support: Windows, macOS, iOS, Android, Linux |
| Release Info: | Minor Update on Oct 10, 2017 |
| Release Notes: | Multi-platform Support: Windows, macOS, iOS, Android, Linux |
| Related Tags: | Business Intelligence Data Analysis Data Acquisition Data Mining Data Visualization |
Reviews
Reviews of TeeBI for RAD Studio Suite 2018
You can be the first to write a review of TeeBI for RAD Studio Suite!Other products submitted by this publisher
TeeChart for .NET charting component offers full set of Chart types and a combination Gauge types for dashboard applications. It supports Windows Forms, ASP.NET/HTML5, WPF, Universal Windows Platform (UWP) and Xamarin iOS, Android & Forms.
TeeChart for JavaJava Charting components Library shipping with 100% sourcecode included. It offers 50+ Chart styles, 30+ financial and statistical indicators. Supports Swing, SWT, Android and major Java IDEs and Editors.
TeeChart for PHPObject-Oriented Charting component library completely written in PHP and ready to be used in any PHP scripts. Includes 25+ chart types and variations, a toolset for additional charting functionality, like Annotation, Colour Banding with Transparency.
TeeChart Java for AndroidCharting library for Android platform, written in native Android Java and supports most teechart series types including pie chart, line chart, points, area, bar, gauges and maps and 2D, 3D formats.The Charting library includes 100% native Java code.
TeeChart JSJavaScript/HTML5 charting library that plots graphs to all compatible browsers in native JavaScript format using the HTML5 Canvas element.
Most Viewed Windows Software Development
Bytescout PDF To HTML SDK 8.7.0.2980
TeeBI for RAD Studio Suite 2018
Bytescout PDF Viewer SDK 8.7.0.2980
Devart ODBC Driver for SQLite 3.1
Devart ODBC Driver for PostgreSQL 3.1
M4V Converter Plus for Win 5.3.3
Verj.io 1.1
Devart ODBC Driver for Oracle 3.1
dbForge Data Generator for SQL Server 7.1
Most Downloaded Windows Software Development
Bytescout PDF To HTML SDK 8.7.0.2980
TeeBI for RAD Studio Suite 2018
Bytescout PDF Viewer SDK 8.7.0.2980
Verj.io 1.1
M4V Converter Plus for Win 5.3.3
Amazon Redshift ODBC Driver by Devart 3.4.2
dbForge Compare Bundle for MySQL 10.0
ClickUp ODBC Driver by Devart 1.0.1
Devart ODBC Driver for Oracle 3.1