Power-Graphs 1.0
Graph software component to be inserted within HTML code using any dynamic language, this dynamic graphs are flash based. Source code samples on how to implement bar graphs and pie graphs, are included in the package.
Product Specifications
| User Rating: | item has less then 1 vote |
|
| FileCart Rating | ||
| Submitted by: | hongo | |
| Homepage | Visit Homepage | |
| License | Demo | |
| Price | $25 | |
| Downloads | 678 | |
| OS Support | Windows Install and Uninstall | |
| File Name | pg10demo.zip | |
| File Size | 0.49 MB ( 500 KB ) | |
| Published | Apr 30, 2006 (20 years ago) | |
| Updated | Dec 14, 2013 (13 years ago) | |
Follow Us!
Latest Searches
mybswhealth patient portal 3 minutes ago
supreme signs 5 minutes ago
elections in israel 8 minutes ago
tet multipleks 9 minutes ago
jtjttjgjkgk 12 minutes ago
image round crop 14 minutes ago
rosario 3 15 minutes ago
german train called 16 minutes ago
web.zduqccn com 16 minutes ago
Popular Searches
id cards 602 times
2025 493 times
2024 386 times
Softperfect 328 times
2026 278 times
Database Workbench Pro 258 times
5g spf sonicwall compatible copper module 258 times
TeraByte Drive Image Backup and Restore 255 times
targetamazon credit card.asp?highlight=0 253 times
Product Details
Internet enabled graph software
Graph software component to be inserted within HTML code using any dynamic language, this dynamic graphs are flash based. Source code samples on how to implement bar graphs and pie graphs, are included in the package. Download a free demo version of Power-Graphs.
Power-Graphs graph software is a great option to make graphs online, creating graphs from asp php .NET perl or any other programming language with html output.
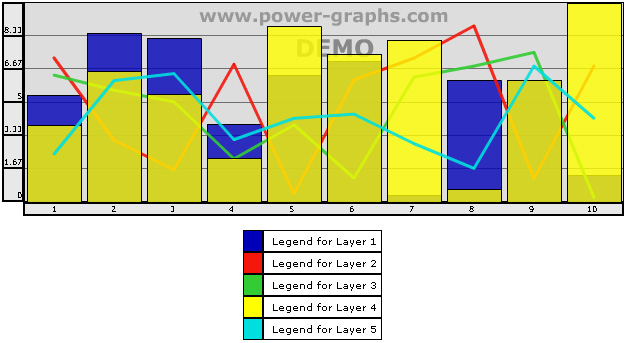
This bar graph software can be used in any internet or intranet application that needs the use of comprehensive graphics in order to display information using bar graphs, pie graphs, and line graphs. Multiple graph layers can be set for comparison, colors are easily customizable.
This graph software tool can be used in a wide range of applications.
Add value to a data processing application, if you have an internet or intranet application that process series of numbers, use this graph software to display assorted data in line graphs, bar graphs and pie graphs with multiple layer feature for comparison. Layers transparency allows to see several series in a bar graph.
If you think you can make Power-Graphs better then source code in Flash is also available, in order to give you the tools for creating a new and improved version which is only in your mind.
ASP source code is provided in order to implement a bar graph calling just one line of code.
This is how a line of code for drawing a bar graph looks like:
call DrawChart(gW, gH, gLayers, gValuesCount, gMaxVal, gMinVal, gTypes, gValuesY, gValuesX, gLegends, gFirstColor)
Graphs are the best way to display information related to business or any other field that require the use of number series analysis. This graph software tool will give you the ability of inserting bar graphs, line graphs and pie graphs within html code, can be inserted in almost any internet enabled application processing data series.
| Release Info: | New Release on Jul 15, 2004 |
| Related Tags: | bar graphs pie graphs charts graphs graph software circle graphs |
Reviews
You must be logged in to write a review
Reviews of Power-Graphs 1.0
You can be the first to write a review of Power-Graphs!Most Viewed Windows Presentations
DOC to JPG/TIFF/BMP/PNG/EPS converter 5.0
Autoplay Menu Designer 5.30
Picture To Video Converter 1.4.6.2
AlbumMe 5.9.0
PicturesToExe 7.5.1
PowerFlashPoint - PPT TO FLASH Converter 4.2
Able Photo Slide Show 2.20.8.11
PowerFlashPoint - PowerPoint to Flash 6.0
Life Poster Maker 3.7
Most Downloaded Windows Presentations
PPTonTV (PowerPoint to Video Converter) 1.21
DOC to JPG/TIFF/BMP/PNG/EPS converter 5.0
Wondershare PPT2DVD Pro 6.1.5
PowerFlashPoint - PPT TO FLASH Converter 4.2
Picture To Video Converter 1.4.6.2
iSpring Pro 7
AlbumMe 5.9.0
Able Photo Slide Show 2.20.8.11
Life Poster Maker 3.7